Permalink
Cannot retrieve contributors at this time
Name already in use
A tag already exists with the provided branch name. Many Git commands accept both tag and branch names, so creating this branch may cause unexpected behavior. Are you sure you want to create this branch?
FeatureSpaceDiagram/README.md
Go to fileThis commit does not belong to any branch on this repository, and may belong to a fork outside of the repository.
27 lines (19 sloc)
1.28 KB
This file contains bidirectional Unicode text that may be interpreted or compiled differently than what appears below. To review, open the file in an editor that reveals hidden Unicode characters.
Learn more about bidirectional Unicode characters
| # THIS FORK NO LONGER MAINTAINED; INSTEAD SEE: https://github.com/TheRensselaerIDEA/FeatureSpaceDiagrams | |
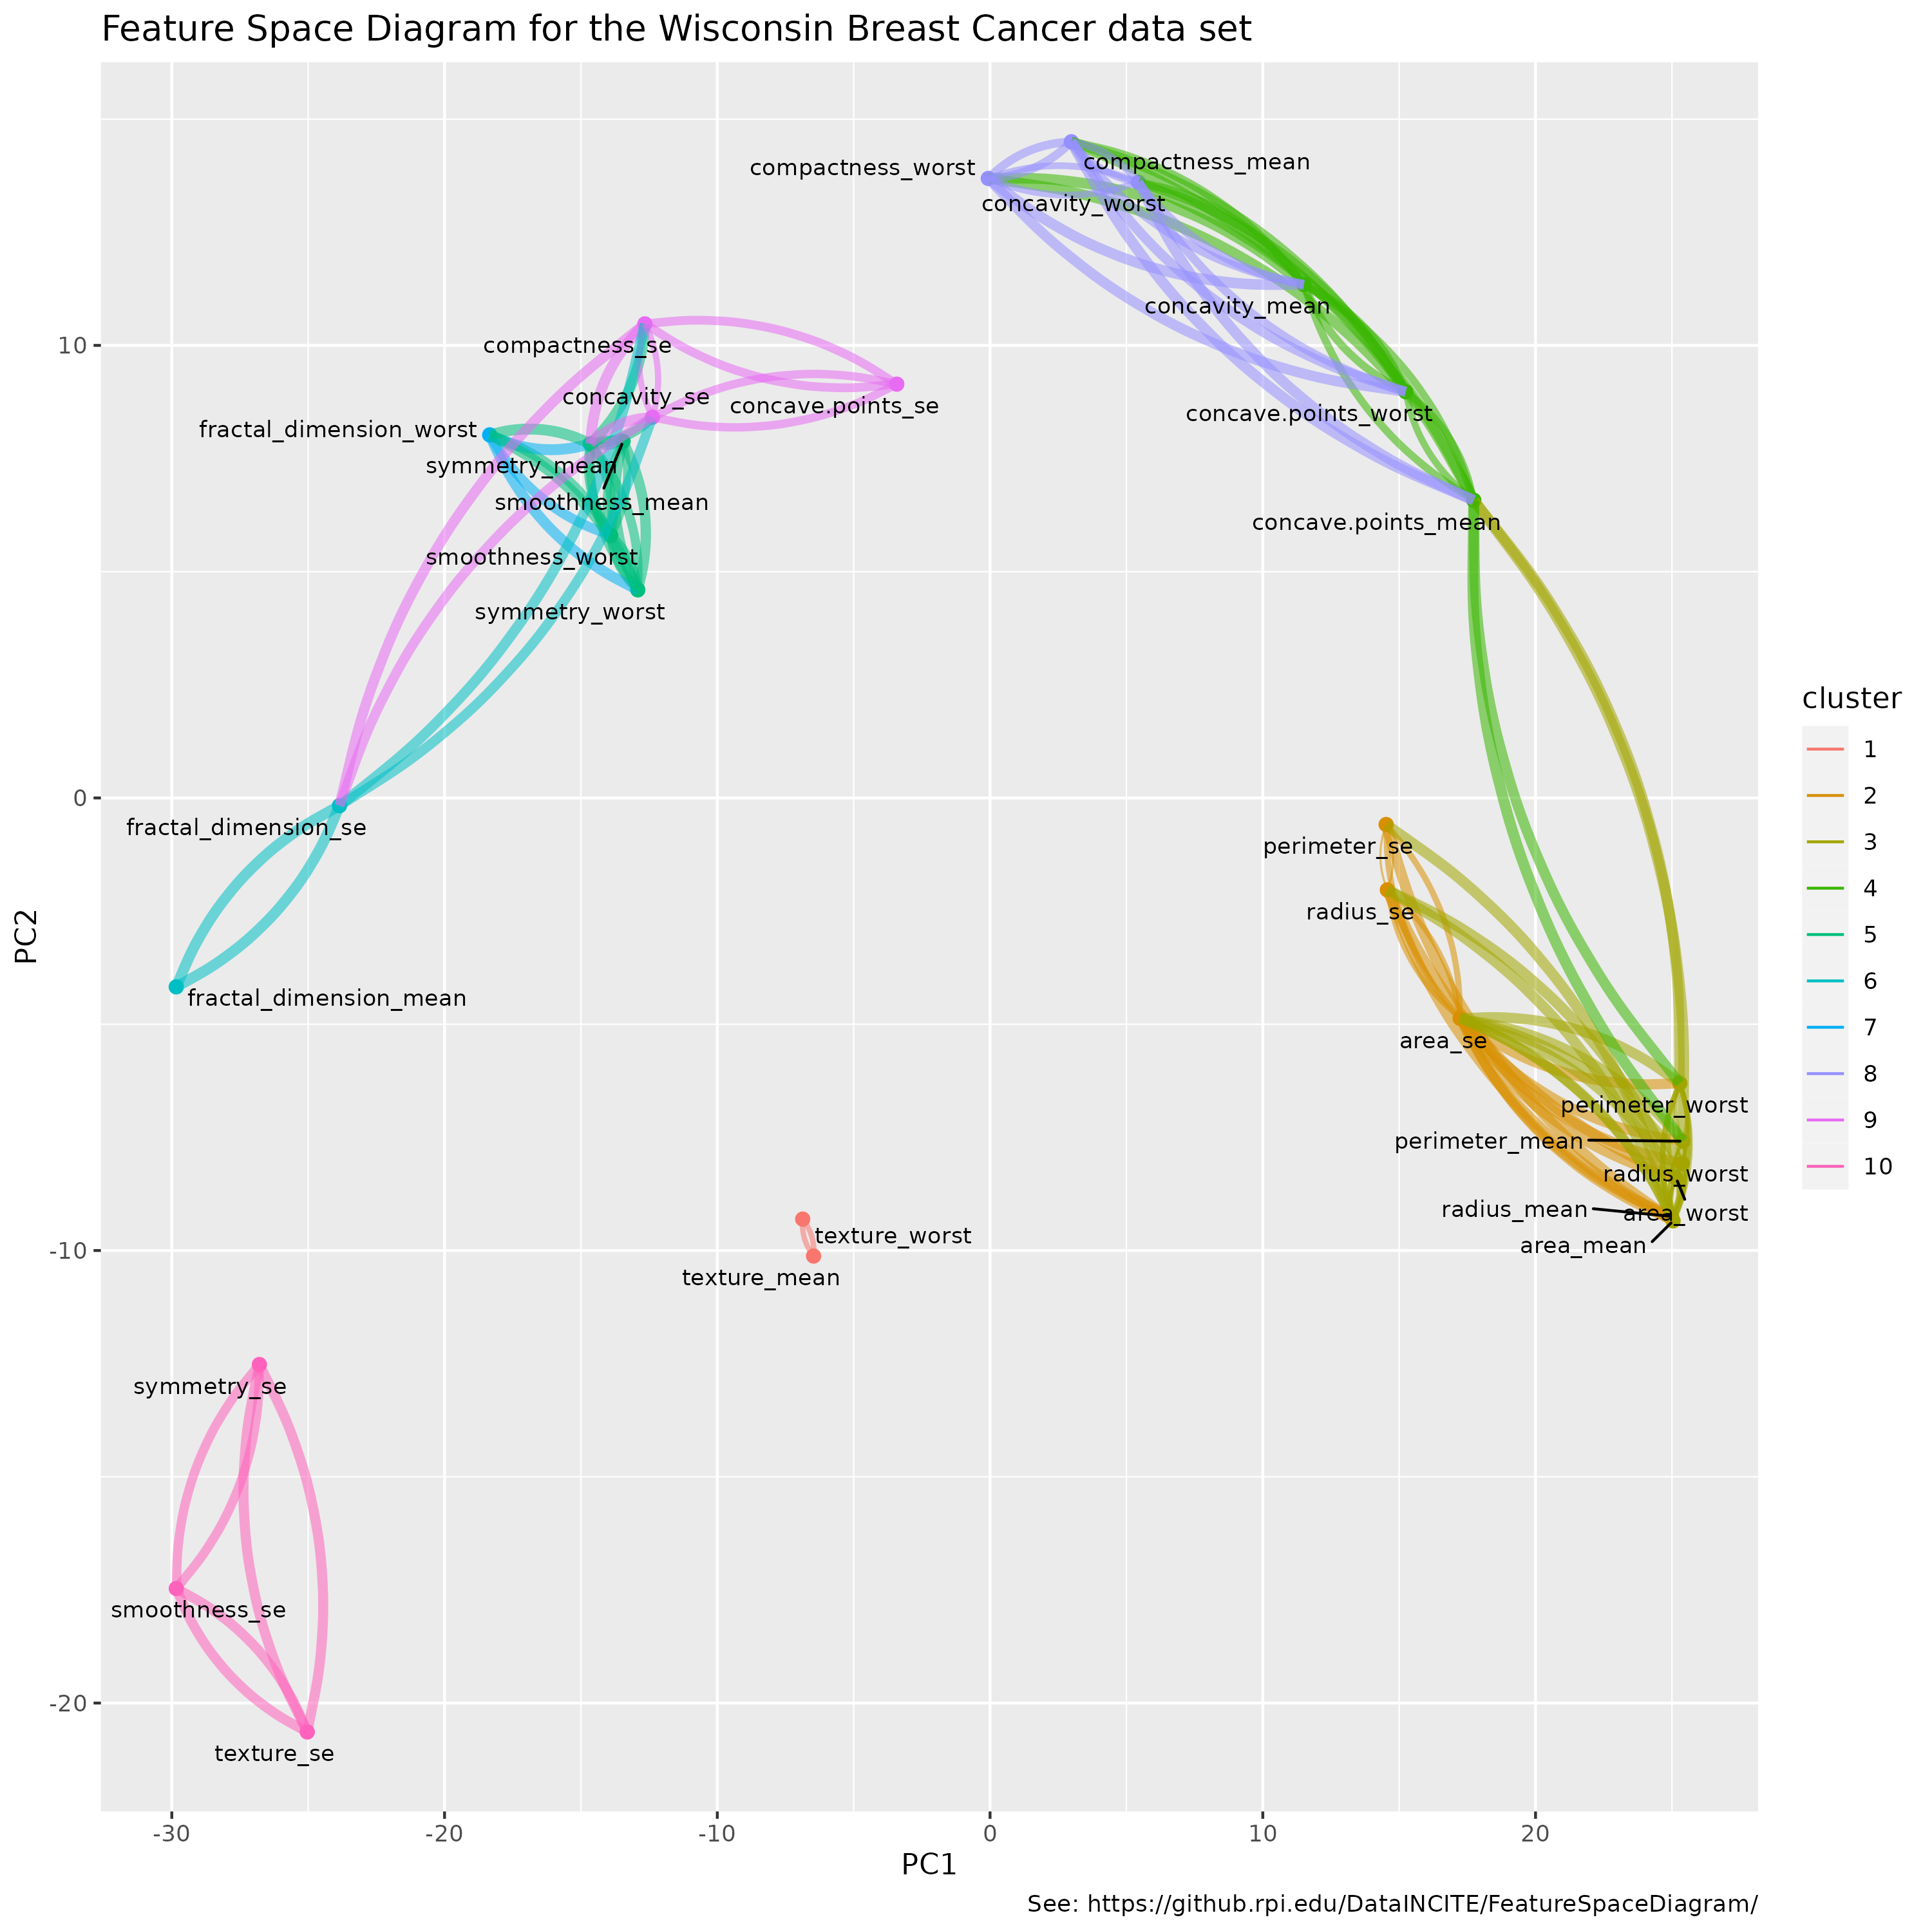
| # FeatureSpaceDiagram | |
| Generating feature space diagrams in R | |
| This is a first effort to implement "feature space diagrams" in R, inspired by: | |
| https://towardsdatascience.com/escape-the-correlation-matrix-into-feature-space-4d71c51f25e5 | |
| ## Workflow | |
| Our workflow is generally as described in the original post: | |
| * Generate the correlation matrix | |
| * Create a distance matrix from the correlation matrix | |
| * Original approach: Take the absolute value of correlation matrix and subtract each value from 1. | |
| * Revised approach: use R's `dist()` function to provide different approaches to finding distance | |
| * Use PCA to reduce our NxN distance matrix to Nx2. | |
| * Plot each feature’s location using the first two principal components. | |
| * Use Feature Agglomeration (hierarchical clusterimg) to generate feature clusters. | |
| * Color each feature by its cluster. | |
| * Draw lines to represent relationships based on some threshold | |
| ## Acknowledgements | |
| Many thanks to [Win Cowger](https://mastodon.social/@wincowger) and the rest of the [#Rstats Fediverse community](https://mastodon.social/@rstats@a.gup.pe) for the inspiration! | |
|  |